Estimated reading time: 7 minutes
Chesil’s dragon teeth represent a rare and increasingly vulnerable relic of WWII coastal defenses, preserved within a dynamic environment– perfect for photogrammetry site monitoring. This article examines how photogrammetry and Global Mapper can transcend traditional visual recordings. Photogrammetry produces quantitative, precise, and repeatable measurements of these structures. By focusing on terrain modeling, elevation analysis, and quantifiable change, the study demonstrates how digital methods can support long-term monitoring and informed heritage management. Moreover, leveraging Blue Marble’s Global mapper to assist in our GIS mapping, Simon’s latest scan illuminates more of Chesil’s history.

Following a strong storm, the Fleet warden alerted Simon to shoreline-shifting changes at Chesil’s Dragon’s Teeth, prompting a return visit to reassess the site. In our previous blog, Simon was able to capture a smaller portion of the site after coordinating a drone permit. In total, Simon has revisited the site three times. Each time leading to an expansion of the digital record of Chesil’s WWII defenses. With his most recent survey, Simon was able to capture a previously hidden portion of the site. As a result of a strong winter storm, erosion is evident on the site. Recently, stripping the shingle from from the seaward side of the beach and unearthing more defenses.
Chesil’s Dragon Teeth and Their WWII Context
In a previous blog, we examined the dragon teeth, a defensive system erected along Chesil’s shoreline in the early 1940s. Although the defenses have withstood the test of time, engineers built them rapidly as a rudimentary World War II defense, designed to prevent enemy tanks and vehicles from advancing inland. These barriers adding to Britain’s coastal fortifications against the German threat. Today, they remain as solemn monuments to wartime resilience and a reminder of the existential threats of the 1940’s.
Coastal Dynamics Affecting Dragon Teeth at Chesil Beach
Global Mapper has a powerful suite of tools for creating and analysing GIS data. As a result, Simon investigated how much shingle the storm had moved and the total volume of material it had shifted.
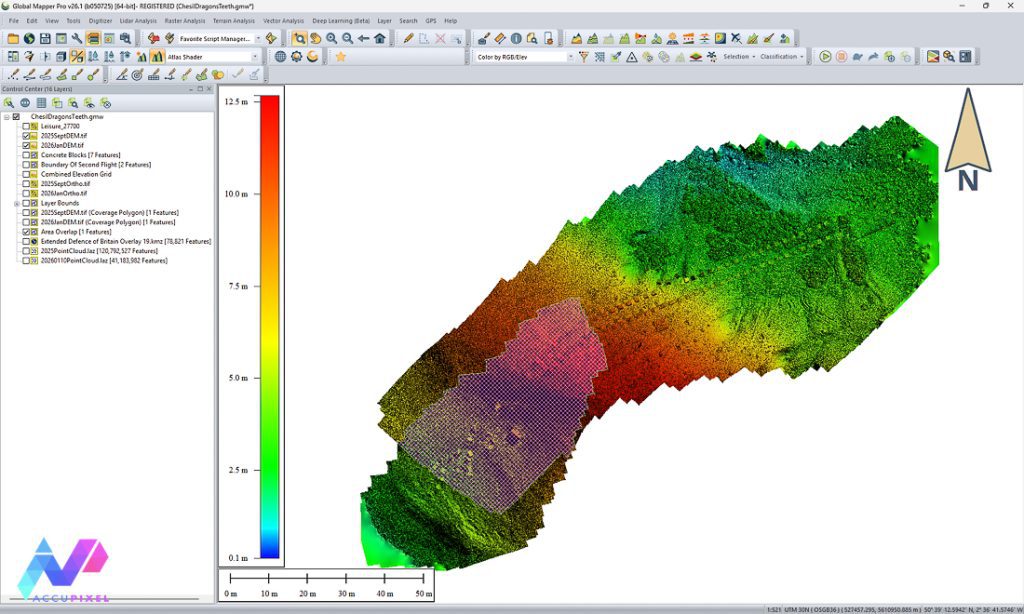
Firstly, we created a new shape layer. In doing so, this defined the overlap area between the two DEMS.
As a next step, we ran terrain analysis using the boundary to define the area for volumetric calculation.
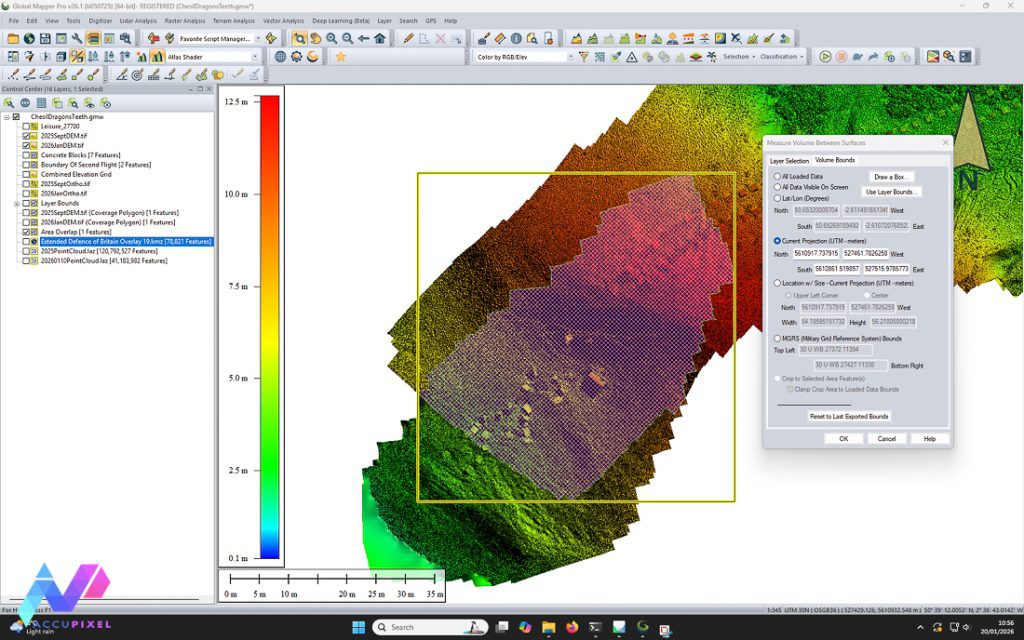
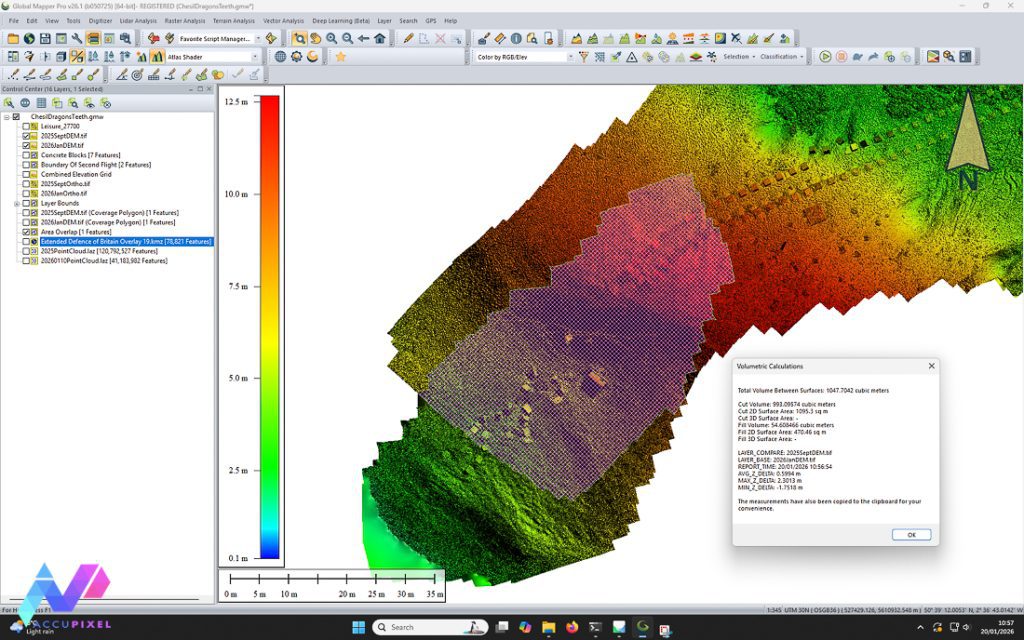
By measuring the volume between the two DEMS an estimated 933 cubic metres of beach had been relocated from Chesil’s dragon teeth.
Chesil’s Dragon Teeth: Quantitative Analysis Using Global Mapper
In short, extrapolating this estimate across the entirety of Chesil suggests that the storm moved an estimated 1.359 million tonnes of beach material.
Now this figure is for fun and idle curiosity. However, it comes with a huge range of guesstimates and assumptions:
- The density of the beach is akin to damp pea shingle
- The size of stones is uniform along the entire 19kms of beach
- Movement of material was uniform
However, we know nature does not work to these rules. The beach material is naturally graded by the sea. The stones sorted by size from pea sized in the west to fist sized in the east. It is said local fishermen could land at night and know where they were by feeling the size of the stones around them, it’s very consistent.
Also, Simon was surveying a small section of a much larger beach, just 39m from 19,000 total length is hardly significant. Consequently, increasing the Dragon Teeth surveying area size would add more insight to Chesil’s dynamic shoreline.
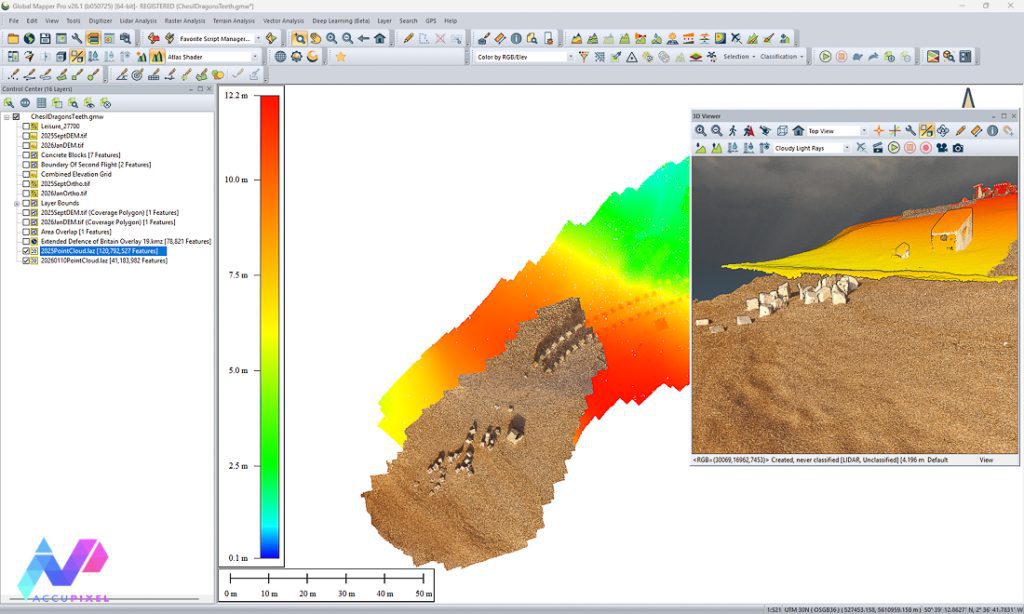
Visualizing Photogrammetry Data in Global Mapper
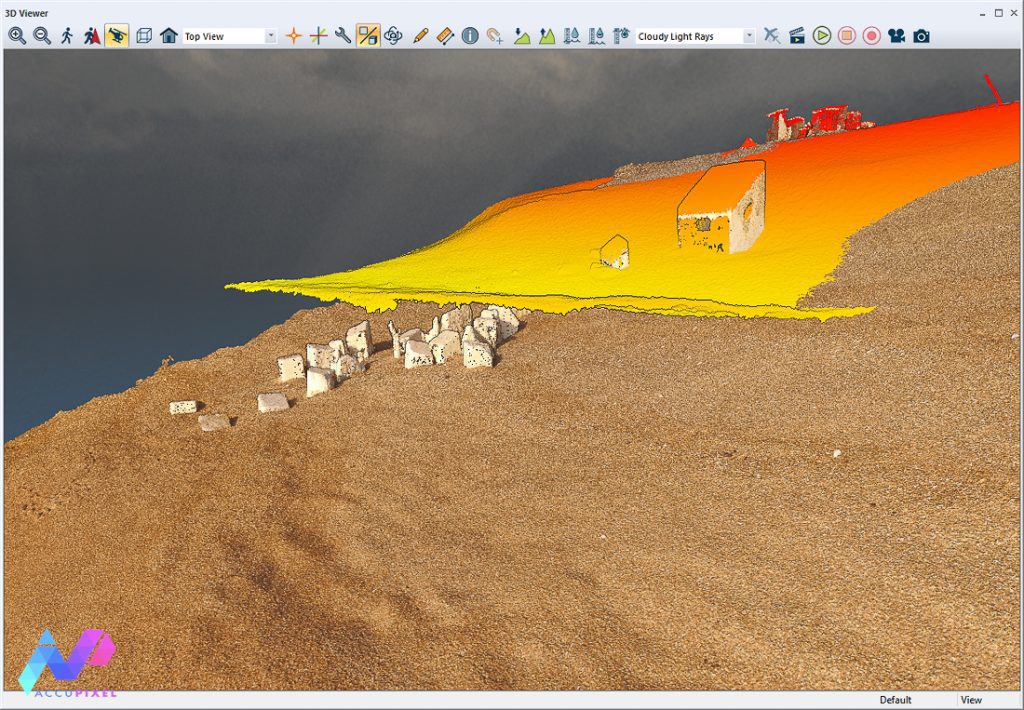
Nevertheless, it’s fun to play with data. Global Mapper has some cool tools to view point clouds and other 3D objects and in this case the point clouds have been imported in LAZ format.
In fact, Global Mapper can consume third party and web online dataset too, enriching the materials available:
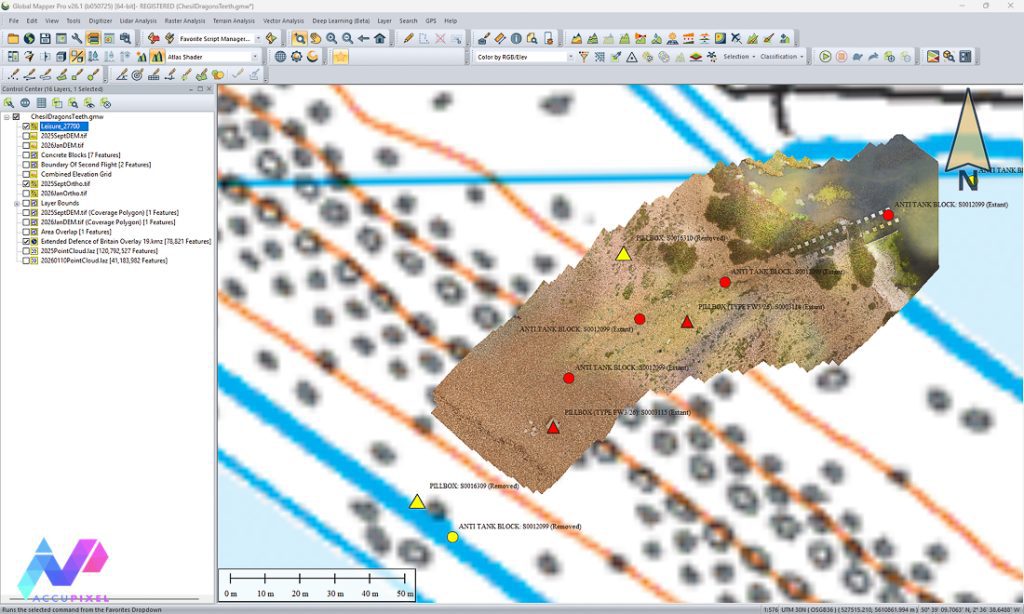
With third party data loaded into Global Mapper additional meta data enriches the project. The underlying map is from the Ordnance Survey web mapping service. A live update feed that serves up the finest maps of the UK.
Photogrammetry Data Capture at Chesil Beach
Today, the defensive Dragon’s Teeth at Chesil, built in 1940, litter the landscape, and most remain extant. History buffs have captured and recorded most of what remains. Also, the Pillbox Study Group website is a fantastic resource for what is very accessible and tangible history.
Conclusions on Chesil’s s Dragon Teeth
Despite having two previous surveys of the dynamic area surrounding Chesil’s Dragon Teeth, a recent storm revealed previously undocumented defence structures. Simon’s capacity to coordinate an additional drone permit enabled the creation of a third survey. Thus, expanding the digital record of the site. In doing so, Simon’s latest scan documents defence structures not visible in the two previous scans. Additionally, an opportunity to quantify the recent erosion of the site. Using a combination of photogrammetry and Blue Marble GIS, we can determine the volume of the erosion with precision. This survey is of importance as it demonstrates the capacity for photogrammetry for continuous site monitoring. Ultimately, photogrammetry records and visualizes site changes for cultural heritage and infrastructure necessitating continuous monitoring.
Interested in learning photogrammetry? Please take a look at our online courses available, we are happy to help you start your journey!