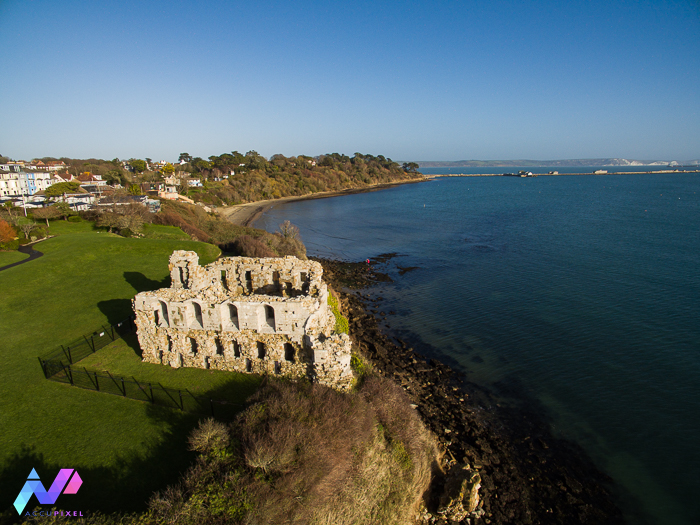
Overlooking Portland Harbour, England, is the at risk cultural heritage site of Sandsfoot castle. Unfortunately, it’s at risk of collapse thanks to coastal erosion. What can drone photogrammetry do to help mitigate the risk?
Dating from the reign of Henry VIII and completed in 1541 its creation was triggered by Henry’s decision to split with the Catholic church. Thanks to family connections to Charles V the Pope took things personally and formed an alliance intended on invasion. Henry responded by building a series of defensive castles along the south coast, of which Sandsfoot was one.
Since 1583 erosion has been a concern and now there is a debate about the castle’s future. The castle is now at risk of further loss and is a perfect example of how photogrammetry can preserve the remains, and offer some far deeper analysis that can offer comparative measurement.
Just before Christmas 2022 AccuPixel visited the site. A couple of short drone flights were enough to capture the extent of the castle and shoreline with 364 aligned images processed in 3DF Zephyr.
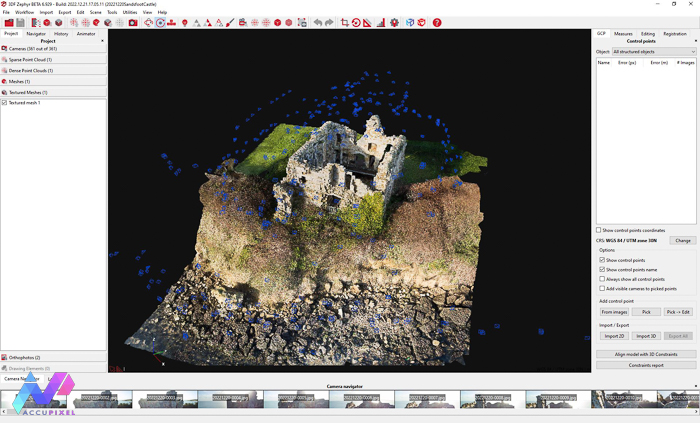
Lighthing conditions on the day fit the description as harsh. The low winter sun cast some very strong shadows but nevertheless Zephyr worked well extracting details. The model is viewable on Construkted.com and is embedded here:
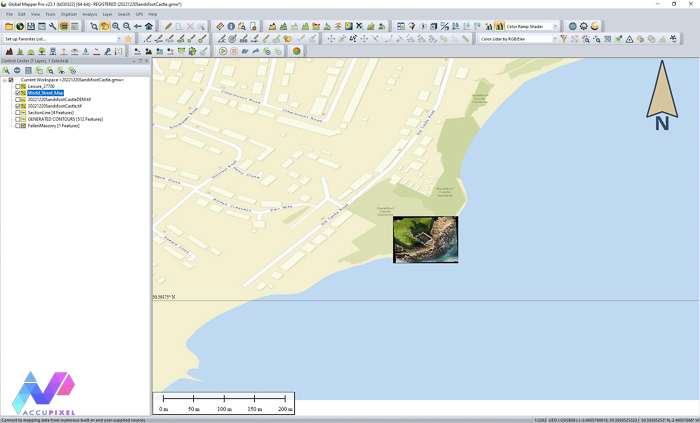
After creating the mesh and deriving ortho mosaic and DEM the files were imported into our favourite GIS tool – Global Mapper – for further analysis. A step forwards in the documentation of an at risk cultural heritage site.
Layers
Global Mapper segregates information using layers and this can include formats such as the elevation DEM and raster ortho mosaic, vector data points and lines, or online tiled map services such as World street View:
Contours
Using the DEM as source contour lines can quickly be generated as a separate vector layer:

Sections
Taking a slice through the site can help visualise the terrain. In our example, we have drawn four section lines, each of which can then create a path profile:

Volume
The at risk cultural heritage castle originally had a gun gallery facing southeast. However, it was lost to the sea sometime during the 18th or 19th century. This section of the castle is still present on the beach and is very much in kit form…a lot of masonry is still there.
One chunk of this section remains, and you can accurately estimate its volume using Global Mapper’s analysis tools.
The first step is to draw an area feature around the block of masonry. This feature can then be of use as a boundary for analysis:


Analysis of the block on the beach indicates there is a total of 23.281m3 of fallen masonry inside the area feature. Volume analysis can work on lines too but area analysis works best when handling clearly defined features such as this.
Manually Rectified Layers for At Risk Cultural Heritage
Not all content carries geo referencing but nevertheless has significant value.
Global Mapper allows manual rectification of raster source layers and we can use this to load an outline map into the project and place it in approximate context:

These layers enhance communication and understanding of the extent of loss to the sea. Sandsfoot’s gun gallery has gone as the cliff has eroded by approx 10m.

Summary of At Risk Cultural Heritage Documentation
Furthermore, you can compare data gathered from subsequent drone flights to this baseline. Analyze and measure future changes in Global Mapper. Meanwhile, the at risk cultural heritage site is not always constant. Therefore, we can estimate the rate of erosion and hopefully plan to secure the future of the castle to prevent further collapse.
For comparative work, photogrammetry is a cost-effective and accurate tool. It quickly records and preserves the as-is condition. Consequently, our work with mountain biking trails demonstrates its application for objective measurement.
Lastly, If you require more information or detail please use the contact us page to get in touch.
Very positive work, offering real insight and future potential.
Civic pride comes from maintaining, and even restoring our history
Another interesting blog, great start to the year. I’ve only just started using 3DF but really liking it so far. Could you suggest a means of sharing the finished models with our clients via a web based portal that would have some form of basic measurement tools? I took a look at Construkted and there does seem to be anything.